
Data Science · Practical guide
A practical demand forecasting plan for retail teams
Start with the stock or capacity decision, test against a simple baseline, and turn uncertainty into a planning process.
A forecast is useful when it changes a decision. For a retail team, that might mean how much to order, where to hold stock, or which products need a planner's attention. A model that looks accurate in a notebook can still be unhelpful if it predicts at the wrong level or arrives after the order deadline.
Before choosing an algorithm, write down the decision, the time available to act, and the cost of getting it wrong. That gives the work a practical target and helps establish whether better data, a simpler planning rule, or a more capable model is the right next step.
Build the forecast around the planning decision
Define the level and horizon
Decide whether the team needs a forecast by product, store, region, or category. Then match the horizon to the actual process. Weekly replenishment with a two-week lead time needs a different evaluation from a quarterly capacity plan. Record how often the forecast must refresh and who will use it.
More detail is not always better. A store-product series may be sparse even when regional demand is predictable. Consider whether aggregation, grouping similar products, or a hierarchy makes the results more stable. A useful forecast should be understandable at the level where a person makes a decision.
Separate sales from demand
Observed sales do not always reveal unconstrained demand. Stockouts can make a popular product look weak, while returns, missing transactions, or channel changes can distort the record. Promotions, price changes, holidays, and product launches may create patterns that will not repeat in the same way.
Start with a data audit. Check date coverage, product identifiers, units, returns, availability, and the meaning of a zero. Keep a record of which inputs were actually known at the time a forecast would have been made. Using information from the future produces an evaluation that cannot be reproduced in operation.
- Which products were unavailable, and for how long?
- Are promotion dates and prices recorded consistently?
- Have product codes, pack sizes, or channels changed?
- Can historical inputs be reconstructed for each planning date?
- Who can explain unusual peaks or gaps?
Establish a baseline before adding complexity
A seasonal naive forecast, moving average, or existing planning rule provides a comparison that everyone can understand. For weekly data, a relevant baseline might use the comparable seasonal period, with adjustments justified by the business context.
The baseline should use the same information and planning horizon as the proposed model. If a complex model does not improve the decisions that matter, extra maintenance cost may not be justified. It is also possible that the biggest benefit comes from fixing inconsistent inputs or making the existing forecast available on time.
Backtest the way the business would operate
Use rolling time-based tests: train on earlier periods, predict later periods, move the cutoff forward, and repeat. Keep a final period separate from model selection where the data supports it. Reconstruct feature availability at each cutoff, including promotion plans and price information.
Report errors by horizon, product group, and demand pattern. A single average can hide serious problems for fast-moving items or intermittent products. Inspect bias as well as error size: repeated underprediction and overprediction have different stock and service consequences.
Choose metrics carefully. Percentage errors become unstable near zero; an aggregate weighted metric may hide poor performance for small products. MAE, MASE, weighted error measures, and business-specific costs can answer different questions. Document the choice rather than treating one number as universal.
Show uncertainty and exception cases
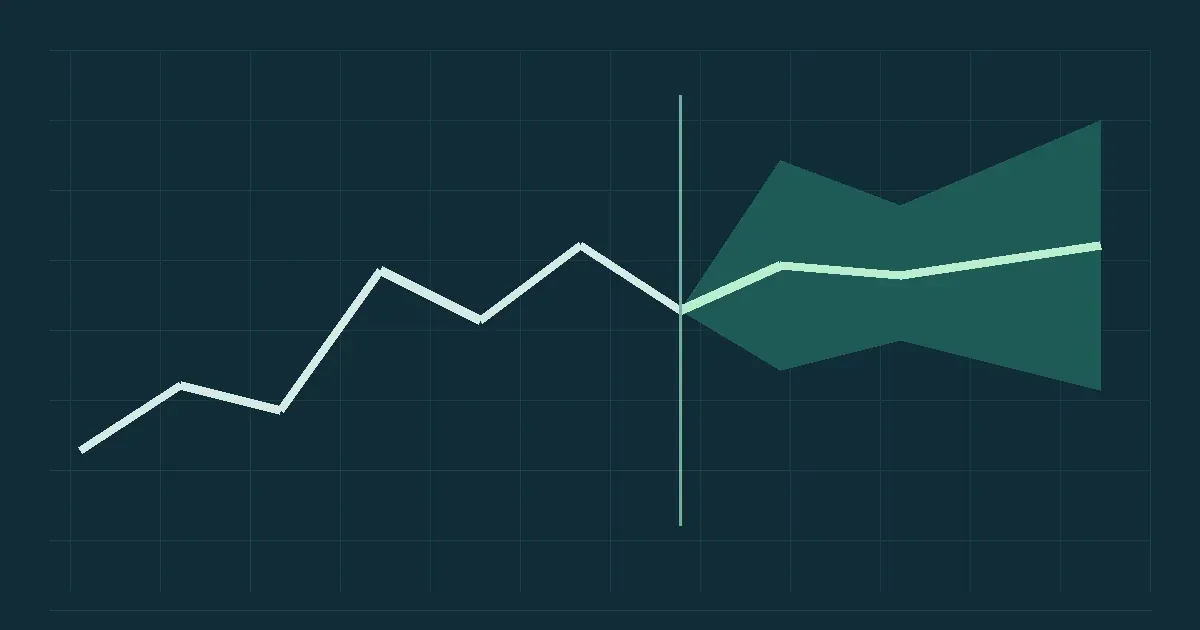
A point forecast is one possible planning input. Ranges or scenarios can help a planner weigh the cost of a stockout against excess stock. Evaluate whether prediction intervals cover outcomes at the intended rate, especially across different demand groups.
Hypothetical example: a retailer deciding next week's order quantity can compare a central forecast with a higher-demand scenario. The appropriate order still depends on lead time, current stock, shelf life, and service targets. The forecast should make these tradeoffs clearer; it should not silently replace the replenishment policy.
Deliver a process the team can maintain
Agree on the output format, refresh schedule, data checks, ownership, and fallback behaviour. A dashboard may be sufficient for a planning team; an operational system may need an API or scheduled file. Explain when a planner should override a result and how that override is recorded.
During a pilot, monitor both model behaviour and the business process. Track missing inputs, prediction bias, overrides, stock availability, and adoption. Improvements in historical forecast error are not the same as improvements in inventory cost or service. Measure those outcomes separately over a suitable period.
What to prepare for a first discussion
Bring a description of the planning decision, sample data fields, lead times, refresh requirements, and the current method. An anonymised example of the output a planner needs is often more useful than a list of preferred algorithms. The first engagement can be a focused data and feasibility review, followed by a backtested prototype if the evidence supports it.
Apply this to your business.
We can review the decision, available data, and a focused first step. Explore data science and forecasting consulting.
Discuss your business challenge