
Retail
Demand Decomposition
The business problem and approach
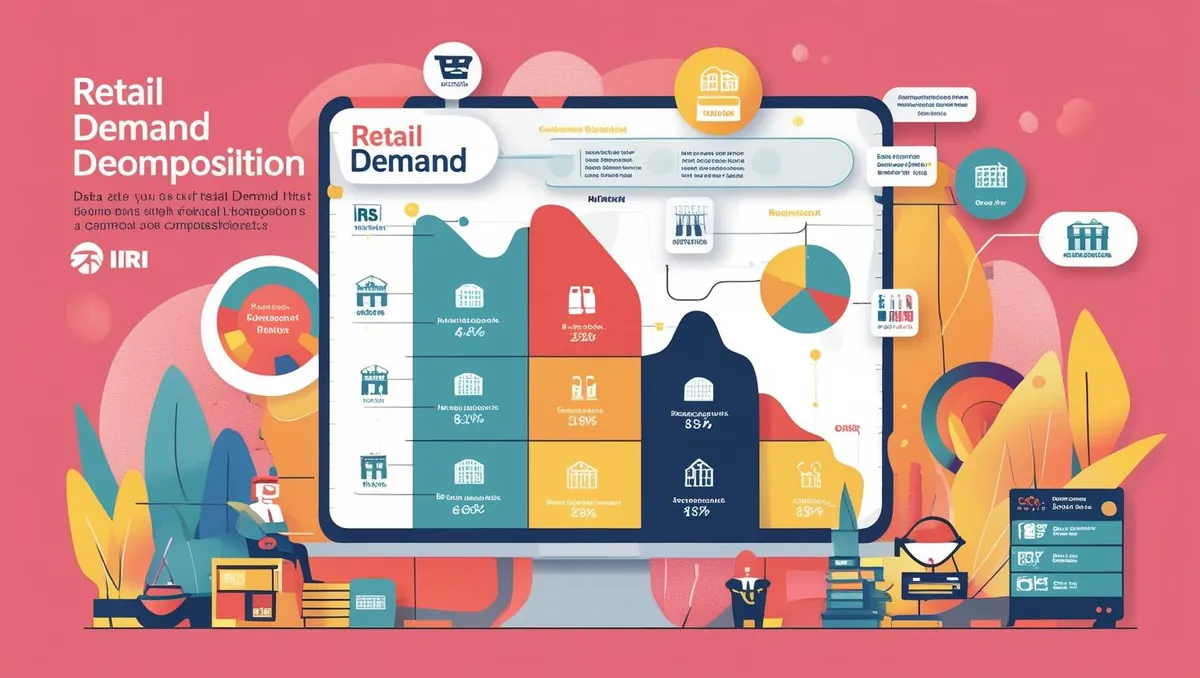
Retail planning becomes harder when inflation, promotions, and events affect unit sales at the same time. This project used IRI sales data to examine those contributions and help explain changes between periods.
The work combined a demand decomposition model with a sales and revenue comparison calculator. Baseline variables, inflation-related changes, and events were represented in the analysis so a business user could examine the drivers behind the headline movement.
The delivered capability supports historical analysis and planning discussions. Historical explanatory fit should be assessed separately from accuracy on future forecasting periods.
Implementation highlights
Modeled the effects of inflation and events on retail unit sales using external sales data and ML, Incorporated a sales/revenue calculator for period-over-period impact analysis, Delivered actionable insights to help retailers navigate economic volatility with quantifiable data
Delivery and outcomes
Delivered a demand decomposition model and a sales/revenue comparison calculator for analysing the drivers of changes in retail unit sales.
Technologies used
- Python
- Machine Learning
- IRI Data
- Regression Modeling
- Sales Impact Calculator
- Data Visualization
Have a related business challenge?
Explore data science and forecasting consulting, or share what you would like to improve.
Discuss your business challenge